
 LinkT&B Editorial Department
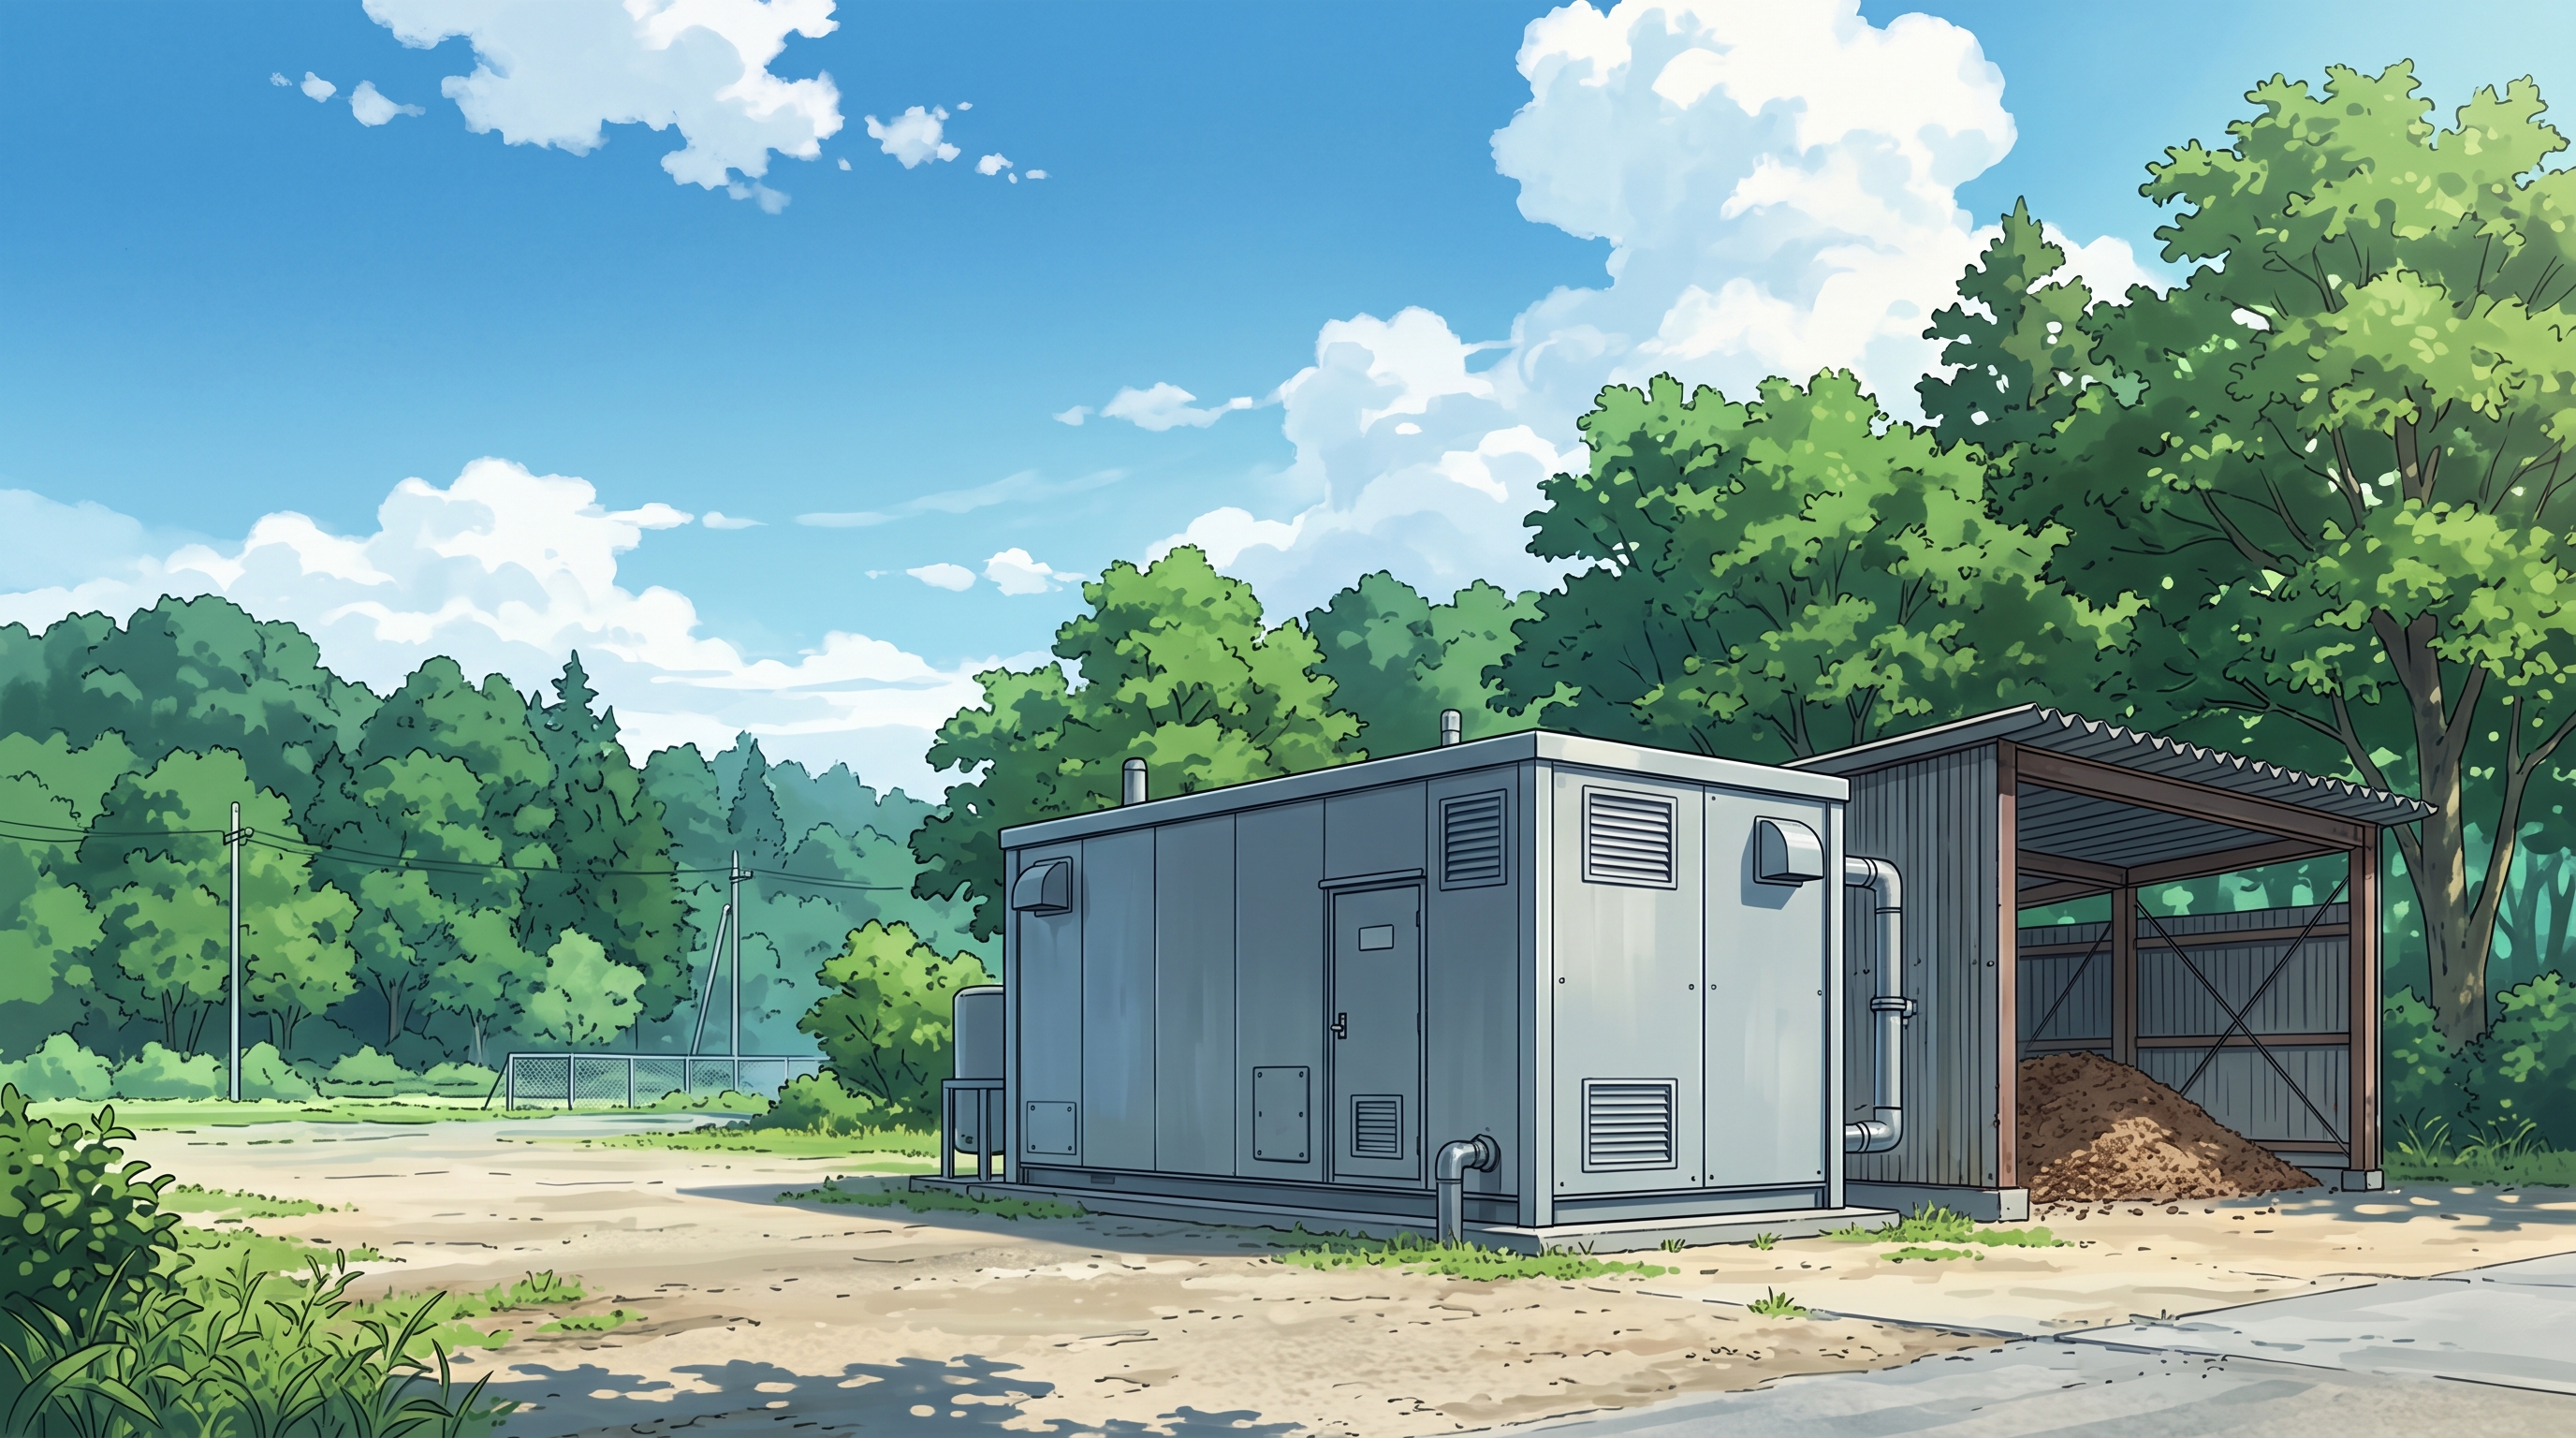
Stable small-scale biomass operation depends on fuel moisture and size, machinery-room temperature, cooling and maintenance. Distinguish wood gasification from steam-turbine generation, and compare manufacturer requirements with actual site conditions.
Contents
- Records for investigating shutdowns
- Power generation by burning wood to turn a steam turbine, and power generation by turning an engine with gas made from wood.
- Two ways to generate electricity from wood
- Equipment of four European companies, fuel and installation environment conditions
- In addition to the outside temperature, the temperature inside the machine room is important.
- Noise countermeasures for engine, exhaust, and cooling fans
- Check the moisture content, size, foreign matter in the fuel, and storage method.
- Record temperature/pressure and operation history and investigate the cause of the stoppage.
- Secure sources of fuel and heat usage, and confirm profitability.
- Related Articles
- Reference materials
- Discuss your project
Small-scale biomass plants can generate electricity from local wood and supply useful heat to nearby facilities. The Forestry Agency’s FY2025 Annual Report on Forest and Forestry notes that the number of operating wood biomass plants rated below 2,000 kW has grown in recent years. [1]
However, it is not easy to extract the output that is included in the catalog throughout the year. The moisture content and size of the tree change. Cooling becomes severe in summer. Even if electricity can be generated, there is no use for hot water. For small equipment, these field conditions impact operation and profitability.
In Europe, there are equipment manufacturers that combine wood gasification and engines, which can be helpful when considering introduction in Japan. In this article, we will consider Japan's high temperature and humidity, fuel management, and noise while looking at the mechanism and usage conditions announced by the manufacturer.
Reference date for confirmation of public information: October 6, 2026.
Records for investigating shutdowns
| Item | What to check | How to assess it |
|---|---|---|
| Fuel | Moisture at delivery, after drying and before feeding | Method, batch and measurement time |
| Temperature | Ambient, intake, room and coolant | Record alongside operating load |
| Operation | Output, alarms, maintenance and noise | Compare against fuel and temperature changes |
Power generation by burning wood to turn a steam turbine, and power generation by turning an engine with gas made from wood.
“What is the difference between biomass and thermal power?” First of all, biomass is a word that refers to a type of fuel derived from living things such as wood. There is also biomass power generation, which burns wood and uses a boiler to create steam that turns a turbine. This is also a type of thermal power generation in that it uses combustion heat. [9]
On the other hand, the small wood gasification equipment discussed here uses an engine to burn gas made from wood. The air sent to the gasifier is suppressed and some of the wood is burned to obtain heat while extracting flammable gases including hydrogen (H₂) and carbon monoxide (CO). The gas is purified and cooled and sent to the engine, which turns the shaft of the generator. Wood chips are not put directly into the engine. [9]
Two ways to generate electricity from wood
Wood gasification + gas engine
- Wood fuelPrepared chips
- GasifierProduces gas containing H₂ and CO
- Gas cleaning & coolingConditions the gas for the engine
- Engine + generatorProduces electricity
Combustion + steam turbine
- Wood fuelBurned in the boiler
- BoilerHeat turns water into steam
- Steam turbine + generatorProduces electricity
- CondenserSteam returns to water and is reused in the boiler
Conceptual process diagram. Equipment configurations vary.
In a steam turbine system, burning fuel heats water, and the steam drives a turbine. In a gasification and engine system, combustible gas produced from the fuel burns inside the engine. Fossil-fuel power plants can also use gas turbines or engines, so it helps to distinguish the fuel from the power-generation process. [9]
Combined heat and power (CHP), which uses heat recovered from the engine or gas cooler for hot water supply, wood/fuel drying, space heating, etc., is often used in small facilities. When choosing equipment, it is essential to decide not only the output of the generator, but also the temperature, time, and amount of hot water to be used. IEA Bioenergy's 2025 report also highlights combined heat and power generation as a key application for gasification. [2]
Equipment of four European companies, fuel and installation environment conditions
Even though we say European manufacturers, they are not concentrated only in Northern Europe. There are manufacturers in Germany, Austria, Finland, etc., and the fuel is divided into pellets and chips. Below are examples of four companies whose specifications can be traced from published materials. The output is the manufacturer's published value, and the conditions for each model are summarized.
Examples of European wood gasification CHP manufacturers and published conditions
The table can be scrolled left and right.
| Manufacturer/location | Model/Electrical output | Fuel conditions | Installation/environmental conditions |
|---|---|---|---|
| Burkhardt Germany | V3.90S+ECO 220 190kW | ENplus A1 wood pellets. Moisture content must not exceed 10% by mass; ash content is also specified. | Introducing applications such as hot water supply, space heating, and drying, which have large annual heat demands. The values for ambient temperature and humidity have not been confirmed in the product materials reviewed this time. [10] |
| Spanner Re² Germany | HKA 70 68kW | Particle size, fine powder, moisture, and ash content of wood chips are specified by classification of P31S/F10/M10/A1.0. | Gasified CHP to provide electricity and heat. There are no values for ambient temperature and humidity on the product page, and installation conditions must be confirmed individually. [11] |
| Fröling Austria | CHP 46/50/56kW | Uniformly dried wood chips with a moisture content of 8-10%. Specify particle size, amount of fine powder, and foreign substances. | Installation room 20-40℃. Ventilation with outside air of 3,600 m³/h or more per unit is specified in the construction guidelines. [12] |
| Volter Finland | Walter 50kW | wood chips. Emphasizes drying and management of moisture, particle size, and foreign matter. Numerical conditions have not been confirmed on the current product page that we checked this time. | The standard specification is for indoor use. Separately set up Walter WP for outdoor use. The ambient temperature and humidity values are not confirmed on the product page that we checked this time. [13] |
Conditions vary depending on model and revision. For Burkhardt, refer to the August 2025 product documentation, for Spanner, refer to the March 2024 technical data posted on the product page, for Fröling, refer to the installation instructions of November 3, 2025, and for Volter, refer to the current Walter official page. "Unconfirmed" does not mean there are no conditions.
For example, Fröling's construction guidelines call for maintaining the temperature of the installation room between 20 and 40 degrees Celsius, and for ventilation to bring in outside air from a lower position and exhaust it from a higher position. Even for manufacturers in regions where the outside air is cold, cooling the machine room is not enough. On hot days in Japan, ventilation and heat radiation must be designed to prevent the room temperature from exceeding 40℃ due to the exhaust heat from the equipment itself. [12]
There are also differences in fuel. You cannot put undried chips into a model that is designed to handle pellets. Even with the same chip type, the amount of moisture and fine powder allowed differs. Your selection will become more specific if you first check whether the fuel available locally and the conditions of the installation room and cooling system match the model.
In domestic small-scale gasification power generation, it has been reported that availability and securing heat utilization sources are issues. This is also pointed out in the 2022 Journal of the Japan Institute of Energy. However, it is not possible to judge the current failure rate or the quality of a particular manufacturer based on this information alone. If operation is unstable, you need to track down where the conditions are out of whack with fuel, cooling, maintenance, or control. [3]
In addition to the outside temperature, the temperature inside the machine room is important.
Let's compare August in Tokyo and Helsinki using observation data from the most recent 10 years (2017-2026). Calculated for August of each year from public data from the Meteorological Agency and the Finnish Meteorological Institute. [8][14]
Comparison of temperature and humidity in August (2017-2026)
The table can be scrolled left and right.
| Location | Monthly average temperature 〈10-year average〉 | Average daily maximum temperature 〈10-year average〉 | Average relative humidity 〈10 year average〉 | Maximum temperature 〈Extreme value within the period〉 |
|---|---|---|---|---|
| Helsinki | 16.8℃ | 21.6℃ | 77.5% | 30.8℃ (2018) |
| Tokyo | 28.1℃ | 32.7℃ | 78.6% | 38.5℃ (2025) |
The 10-year average is the average value for August of each year. The maximum temperature is the maximum value observed in August in the same 10 years, and is not observed at the same time as the average humidity. Aggregation methods such as handling of missing humidity measurements are described in reference material [14]. This is a comparative example of two locations and does not represent the manufacturer's design conditions.
The average daily maximum temperature in Tokyo is approximately 11 degrees Celsius higher than in Helsinki. The average relative humidity at both locations is just under 80%. To consider cooling and condensation, it is necessary to combine temperature and humidity and see which conditions overlap at the site.
For summer 2026, the Japan Meteorological Agency reported substantially above-normal mean temperatures in northern and western Japan and above-normal temperatures in eastern Japan. Design must account for hot days, not just seasonal averages. Solar heating of the roof, recirculating hot air, and equipment waste heat can make a plant building hotter than the nearest weather station. [4]
A cooler uses the temperature difference with the outside air to release heat. On a hot day, even if the temperature difference is small, can the necessary heat be discarded? Even if the demand for hot water supply and space heating decreases in the summer, will engine cooling still be possible? If you record the cooling water temperature, hot water return temperature, and room temperature along with the load, it will be easier to determine whether the cause is insufficient capacity, dirt, or airflow.
Be careful of moisture absorption in the fuel and condensation on the control panel.
High humidity causes the fuel to become damp and condensation to form on panels and piping. Condensation occurs when the temperature of a surface falls below the dew point of the air. It is not determined only by the humidity figure, but also changes in temperature after stopping and during cooling. OMRON's control panel installation materials also explain measures against high temperatures and measures against condensation due to temperature changes. [5]
When cooling the inside of a panel, also look at the path that moist air takes to reach the cold surface. Even if the casing can protect against rain, it does not necessarily prevent condensation from forming inside. Measure the temperature and humidity of the outside air and inside the panel, as well as the state when the machine is stopped, and decide on dehumidification, insulation, and ventilation according to the specifications of the model.
Noise countermeasures for engine, exhaust, and cooling fans
Just because the output is low doesn't mean you can use it quietly in your neighborhood. Gasification/engine systems include the sound and vibration of the engine itself, exhaust noise, and cooling fan noise. The sounds of the fuel conveyor and chip injection are also added. If the plant operates near homes or accommodation at night, you cannot judge based solely on the small size of the equipment.
When looking at the noise values in the specifications, consider the measurement distance, presence or absence of a soundproof cover, and operating load. Sound power level and sound pressure level measured at a certain distance are also different values. The impact on the neighborhood varies depending on the building, openings, orientation of exhaust vents, and site layout, so the manufacturer's values cannot be used as is for site boundaries.
If you enclose it for soundproofing, heat dissipation and ventilation will be difficult. Fröling's installation instructions also require that ventilation and soundproofing be planned by a professional contractor, and that the amount of ventilation should be taken into consideration when using soundproofing covers. A design that combines intake and exhaust noise reduction, exhaust silencers, vibration isolation, and placement to maintain the necessary air flow is required. [12]
The number of noise problems caused by small equipment as a whole cannot be confirmed in this document. Before introducing the system, it is important to decide how it will be used during the day and at night, the distance to nearby areas, and to ask about the actual measurement conditions of the target model.
Check the moisture content, size, foreign matter in the fuel, and storage method.
In wood gasification, there is a difference between being able to procure wood and being able to supply usable fuel. A 2020 survey by the Forestry Society of Japan also raised the issue of ensuring low moisture content and size homogeneity for fuel for small gasification CHP. [6]
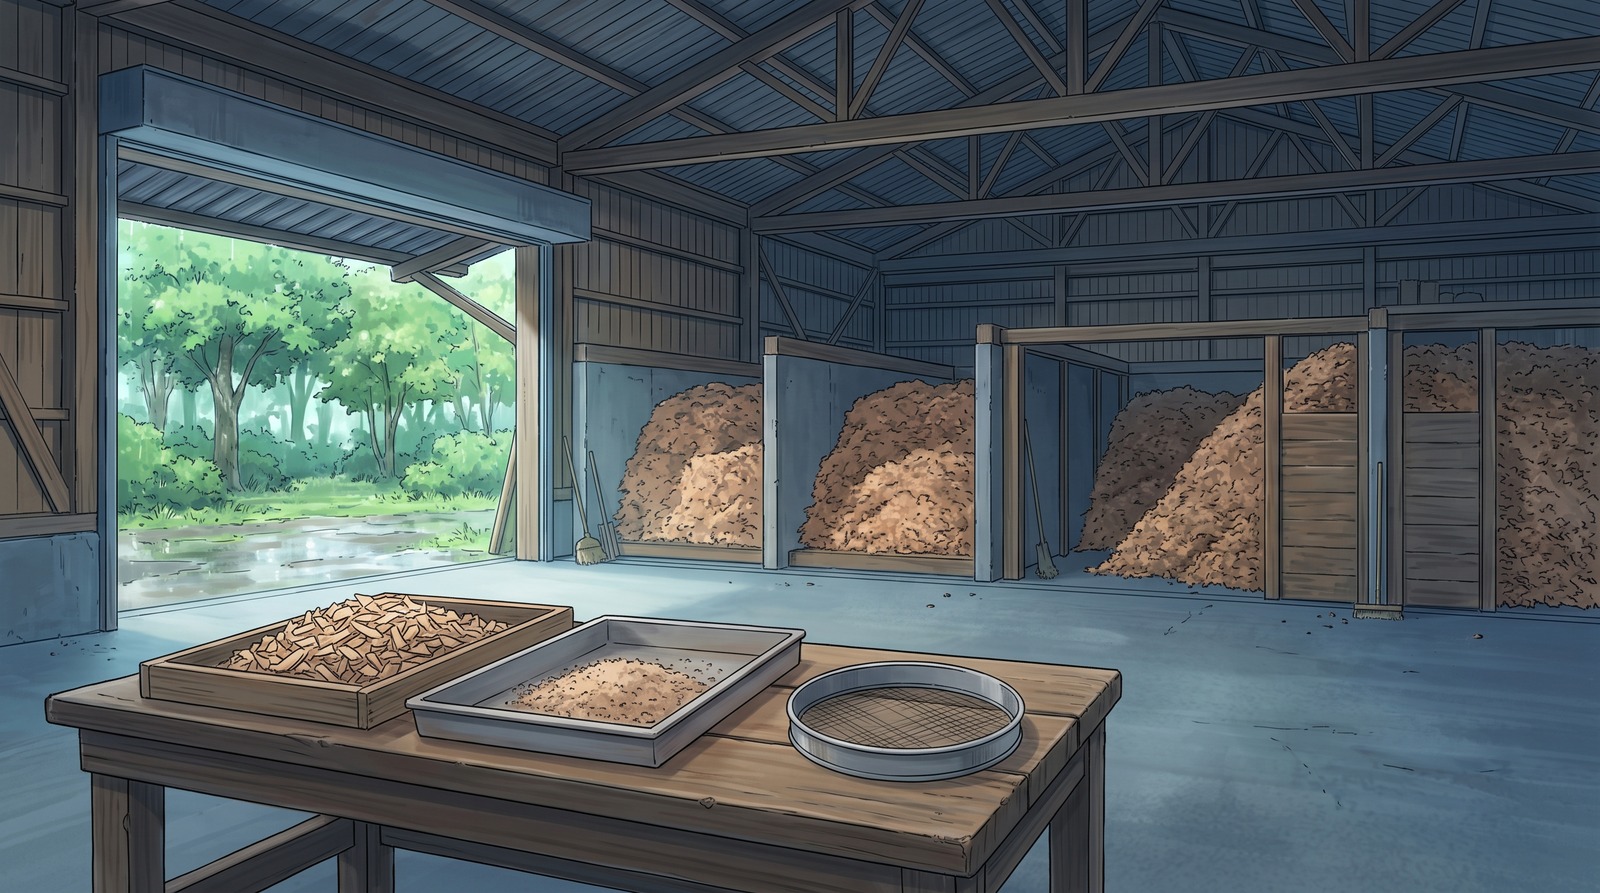
Meeting the fuel specification at the dryer outlet does not guarantee the same moisture content when the chips enter the gasifier. Rainwater can wet chips during storage. In hot, humid conditions, dry chips can also absorb water vapour from the air without any rain. A roof is therefore only part of the solution: storage humidity and storage time matter too. [15]
Estimated when a chip with 5% moisture is left at 90% humidity for 24 hours
Let's calculate the change due to moisture absorption using one type of pine chip. Conditions are 30℃, relative humidity 90%, size 20 x 15mm, thickness 4mm, moisture content 5% at the start. This is when the chips are not stacked, but both sides are exposed to the air, and the temperature and humidity are kept constant. Does not include moisture due to rainwater or condensation.
Estimated value. [15]
Change in moisture content due to moisture absorption (estimated calculation, wet basis)
| Elapsed time | Moisture content | Increase from initial value |
|---|---|---|
| At the start | 5.0% | ― |
| 6 hours later | Approximately 12.9% | Approximately 7.9 percentage points |
| 12 hours later | Approximately 13.7% | Approximately 8.7 percentage points |
| 24 hours later | Approximately 13.8% | Approximately 8.8 percentage points |
Moisture content is expressed as "mass of water ÷ mass of entire chip including water". 5% means 5kg of water out of 100kg of chips. The values in the table cannot be used as the actual moisture content after 24 hours in the bunker.
Calculation method and scope of application
Use the moisture absorption coefficient for Pine from the paper. The diffusion coefficient was calculated from D=D₀exp(−E/RT), D₀=1.121×10⁻⁴m²/s, and E=34,131J/mol. The adsorption isotherm is the GAB formula (MCm=0.053, C=10.7, K=0.76). It uses a fixed GAB coefficient and is not separately adapted at 30°C and 90% humidity.
Using a one-dimensional diffusion method in which moisture enters a 4 mm thick flat plate from both sides, we calculated the change in average moisture content over time and converted it from a dry basis to a wet basis. It does not include resistance to moisture transfer from the surface air, heat generation due to moisture absorption, and changes in the air inside the stacked fuel. The experiment was conducted at 20℃/50℃ and humidity from 0 to 30 to 70%, and the application to 90% is an extrapolation.
The actual amount and rate of moisture absorption will vary depending on the thickness of the chips, wind direction, stacking method, and drying history. It is important not to decide whether to pass or fail based only on the moisture content after drying, but also to manage the roof, floor, and transport route of the fuel storage, and to measure it before loading. If you record the lot and time in the measurement results at the time of delivery, after drying, and before loading, it will be easier to investigate the relationship between stoppages, output drops, and fuel.
Fine wood flour, long chips, bark, stones and metals are also involved in conveyance and gasification. If you look at the dryer, sieve, and conveyor as one supply system, it will be easier to notice problems occurring before the generator. It is important to note whether the moisture content in the fuel specifications is based on a wet or dry basis and the measurement method.
Record temperature/pressure and operation history and investigate the cause of the stoppage.
Even if the rated output is achieved in a short test run, it is still unclear whether the same operation can be continued through the rainy season, extreme heat, and winter. It also records when fuel lots change, when restarts after a shutdown, and when heat demand decreases.
Burkhardt also introduces data management that handles output, operating hours, self-consumption, temperature, alarms, and maintenance information. In addition to tallying the amount of power generated, if you record how the temperature and pressure changed before the shutdown, it will be easier to distinguish between the initial abnormality and subsequent alarms. [7]
Records of equipment logs, fuel measurements, temperature and humidity of outside air and inside the panel, cleaning and parts replacement should be in a form that can be checked at the same time. Record gaps in the data as well. When making adjustments, share this record with the manufacturer/installer and avoid taking measures that extend the apparent operating time by removing protective functions and alarms.
Secure sources of fuel and heat usage, and confirm profitability.
The introduction plan not only multiplies the rated output by annual time, but also takes into account power consumption for drying, transport, and cooling, maintenance outages, fuel costs, and operating manpower. If the recovered heat is left unused and thrown away for a long time, it will not produce any value in terms of planning.
There is fuel that can be used throughout the year. There is heat demand for drying, hot water supply, etc. nearby. It can easily handle summer cooling and nighttime noise. In places where these conditions are met, it is easier to take advantage of the characteristics of small-sized biomass. It is important to adapt everything from fuel supply to buildings, heat utilization, and maintenance to the conditions of the location.
Technical consulting/advisor in the energy field
LinkT&B provides technical consulting and technical advisory services in the energy field such as biomass power generation. Please consult us regarding technical issues such as equipment measurement, control, and evaluation.
Related Articles
When Simulation and Measurements Disagree
Why a Working Prototype Can Stall Before Production
Reference materials
- Forestry Agency: FY2025 Annual Report on Forest and Forestry "Trends in Wood Use" (Power generation, heat use, local ecosystem)
- IEA Bioenergy Task 33 (September 2025): Status report on gasification in member countries
- Kenichi Sasauchi (2022): Latest trends and challenges of biomass small-scale gasification power generation in Japan (Japan Institute of Energy Journal Enerumikusu Volume 101, No. 6)
- Japan Meteorological Agency: Weather in summer 2026 (June to August)
- OMRON: About the installation of the FA controller control panel (Considerations for temperature, humidity, and condensation, PDF)
- Japanese Forestry Society (2020): Ensuring high quality in fuel supply for small gasification CHP equipment (131st conference presentation summary)
- Burkhardt: Digital solutions and automation (Manufacturer published information regarding operation and maintenance data management)
- Japan Meteorological Agency: Tokyo monthly observation values (August of each year from 2017 to 2026) / Finnish Meteorological Institute: Download observations (same period, Vantaa Helsinki-Vantaan lentoasema, observation station ID 100968). Yearly aggregated data (CSV)
- NEDO: Highly efficient biomass power generation using a new method of gasification technology / Agency for Natural Resources and Energy: Biomass power generation, Cogeneration
- Burkhardt: Heat and Power from Wood Pellets (August 2025, PDF) / Wood as source of energy
- Spanner Re²:HKA 70 — technical data
- Fröling: CHP product page and technical documentation / Installation instructions — Fixed Bed Gasifier System CHP (M2640025_en, November 3, 2025, PDF) (Fuel: 7 pages, Installation conditions/ventilation/soundproofing: 26 pages)
- Volter:Walter power plant / Technology
- Calculation method: Tokyo is calculated from monthly values from the Japan Meteorological Agency, and Helsinki is calculated from FMI's monthly average temperature, daily maximum temperature, and hourly average relative humidity. Average of the values for August of each year, with equal weighting for each year. FMI humidity targets August local time and uses valid values for 7,400 hours out of a total of 7,440 hours (missing 40 hours are not interpolated and excluded, acquisition rate of 98.9% or higher for each year). There are no missing values for 10 monthly temperature values and 310 days of maximum daily temperatures. The separation of observation days for daily maximum temperature follows the definitions of each organization. FMI: How to read observations. This table is a 10-year average calculated from publicly available data, and is not the average value provided by the Japan Meteorological Agency.
- Journal of Energy Storage (2026, 153, 121069): Low-cost hygroscopic packed beds for energy storage in solar dryers: Sizing rules from a dual-scale heat and mass transfer model. See Section 2.3 for sample dimensions and test conditions, Table 2 for coefficients, and Section 3.2/Appendix A for flat plate diffusion calculations. The table of 30℃, humidity 90%, and initial moisture 5% in the main text is an original reference calculation using these values, and is not the actual measurement result published in the paper.
Discuss your project
We support circuit design, prototyping and hardware testing. Tell us about the operating conditions and the problem you need to investigate.