
 LinkT&B Editorial
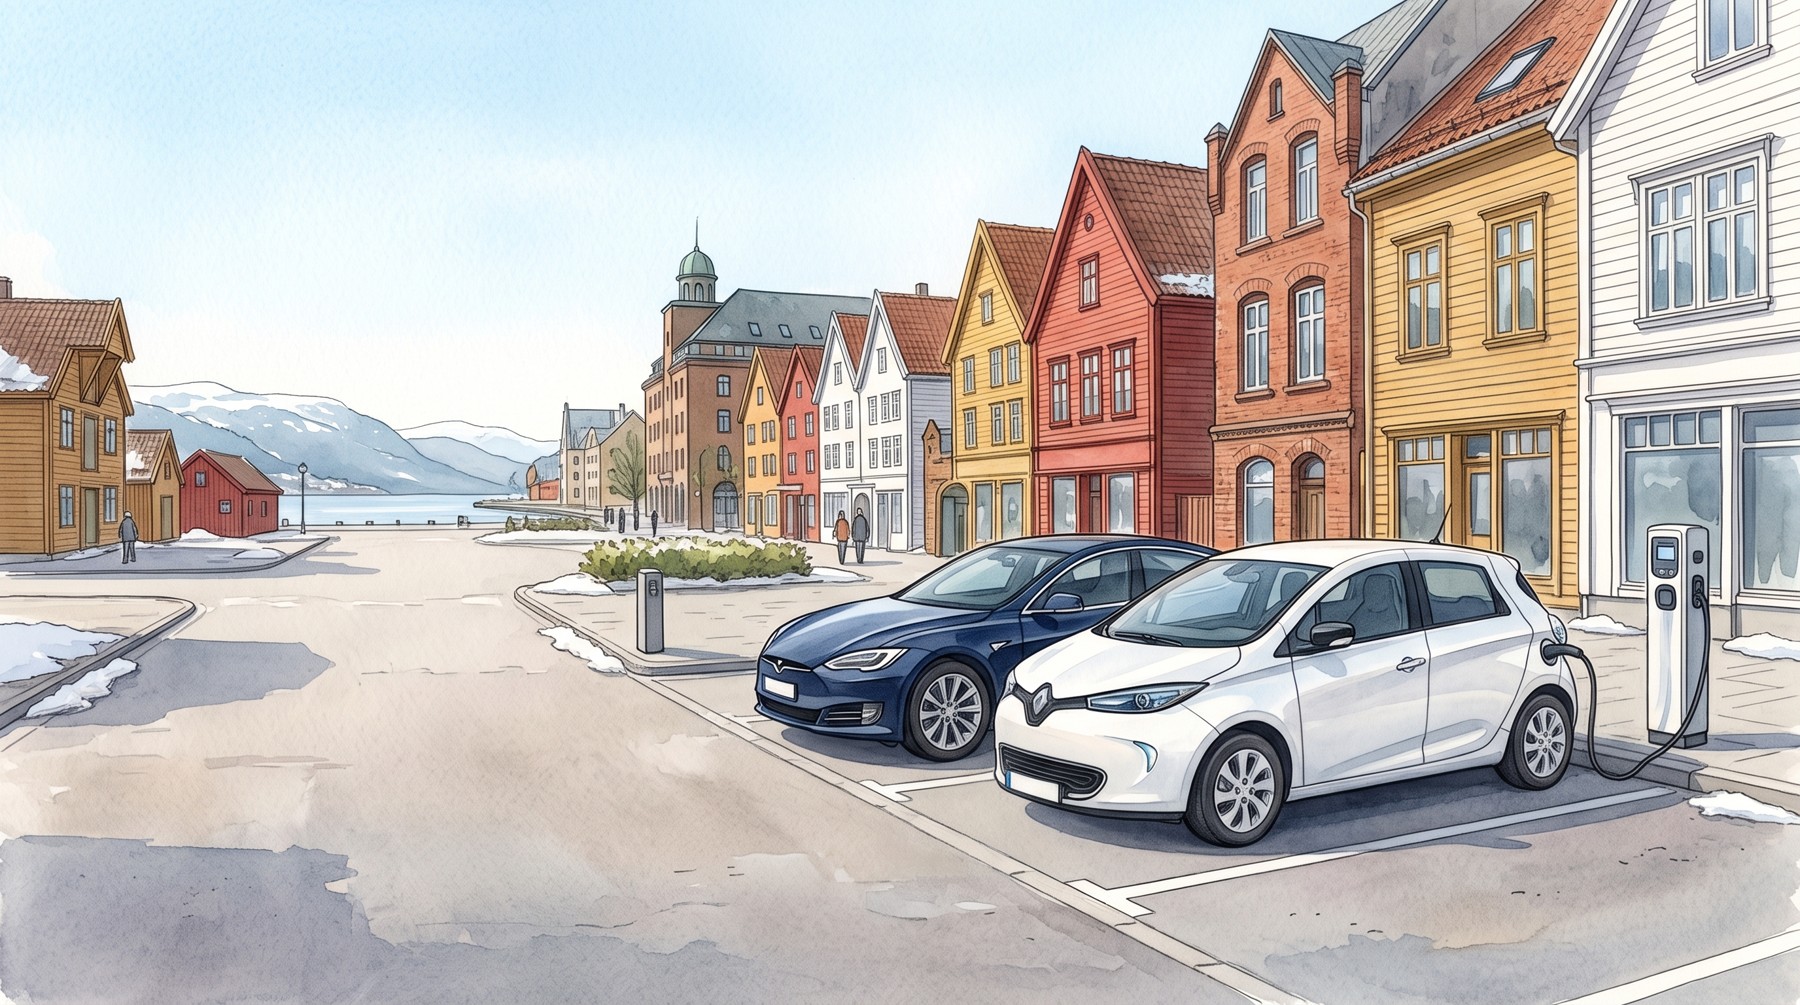
Battery-electric vehicles accounted for 95.9% of Norway's new passenger cars in 2025. How did a cold country get there? Registration data for 2006–2025, tax policy, the arrival of new models and charging infrastructure show how EVs became everyday family cars.
Charge after arriving home, leave in a warm cabin the next morning, and use a fast charger on a longer trip. Norway has developed policies and infrastructure that make these routines practical. This article follows that development, keeping annual sales, the registered vehicle fleet and charging equipment distinct.
In this article
- EV adoption accelerated in the 2010s and passed half of new registrations in 2020
- Norway reduced purchase taxes long before EVs became mainstream
- The LEAF, Tesla and European models gave buyers a wider choice of EVs
- Public fast charging expanded, with CCS2 becoming the main direction
- Public support helped build both public chargers and shared residential wiring
- Charging improved through both compatible connectors and automatic authentication
- EVs made up about 96% of new cars, but about 32% of the registered fleet
- EV owners value running costs, quietness and everyday convenience
- Overnight charging and preheating make EVs more practical in cold regions
EV adoption accelerated in the 2010s and passed half of new registrations in 2020
Aggregating Statistics Norway's monthly registrations shows the electric/zero-emission category rising from 1.4% in 2011 to 12.5% in 2014 and 54.3% in 2020. The 2010s were the turning point, as mass-produced EVs gave buyers more choices.[1]
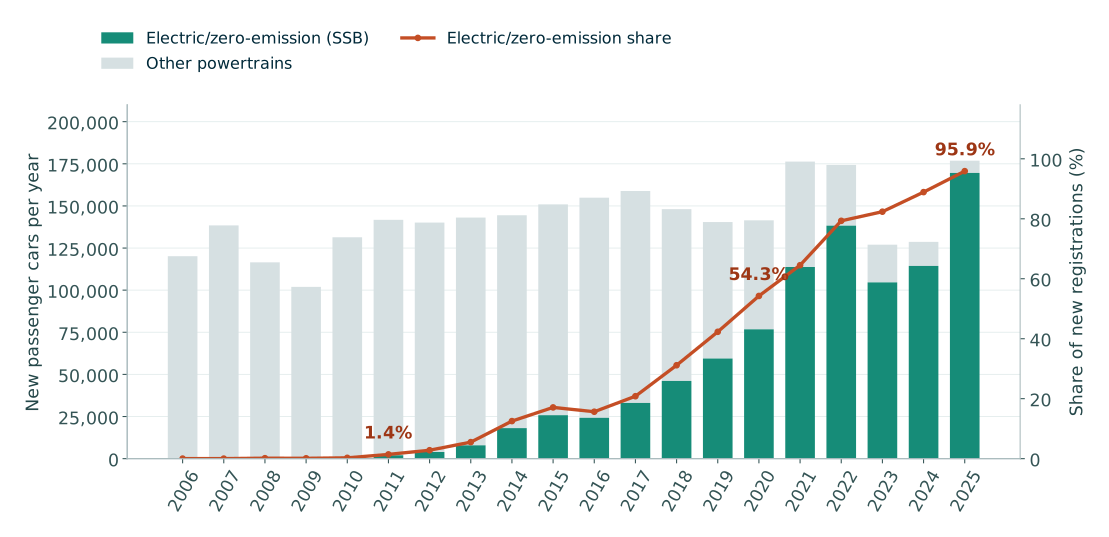
Bars show annual registrations; the line shows the electric/zero-emission share. Annual aggregation of SSB table 14020. Other powertrains include hybrids.
Open a larger chartSeparately, the Norwegian Road Federation (OFV) reported 179,550 new passenger cars in 2025, of which 95.9% were battery-electric vehicles (BEVs). The BEV share remained high at 97.9% in January–September 2026.[2][3]
The transition did not happen in a single year. Tax relief remained in place while buyers gained more models and more places to charge.
View the 20-year registration dataset
The chart uses SSB's “Electric/zero-emission” category. OFV's BEV figures use a different statistical classification and compilation, so their counts are not combined. In the general discussion, EV means BEV; the SSB series retains its statistical label.
| Year | Total | Electric/zero-emission | Share |
|---|---|---|---|
| 2006 | 120,139 | 17 | 0.01% |
| 2007 | 138,426 | 16 | 0.01% |
| 2008 | 116,497 | 178 | 0.15% |
| 2009 | 101,939 | 119 | 0.12% |
| 2010 | 131,386 | 357 | 0.27% |
| 2011 | 141,742 | 2,010 | 1.42% |
| 2012 | 140,115 | 3,938 | 2.81% |
| 2013 | 143,085 | 7,888 | 5.51% |
| 2014 | 144,457 | 18,089 | 12.52% |
| 2015 | 150,917 | 25,783 | 17.08% |
| 2016 | 154,883 | 24,234 | 15.65% |
| 2017 | 158,864 | 33,073 | 20.82% |
| 2018 | 148,083 | 46,129 | 31.15% |
| 2019 | 140,426 | 59,402 | 42.30% |
| 2020 | 141,455 | 76,753 | 54.26% |
| 2021 | 176,318 | 113,738 | 64.51% |
| 2022 | 174,327 | 138,270 | 79.32% |
| 2023 | 126,990 | 104,592 | 82.36% |
| 2024 | 128,661 | 114,368 | 88.89% |
| 2025 | 176,847 | 169,569 | 95.88% |
Norway reduced purchase taxes long before EVs became mainstream
Norway's purchase support was built around exemptions from registration tax and VAT (value-added tax, comparable to Japan’s consumption tax), rather than just cash grants. The registration-tax exemption began in 1990 and the VAT exemption in July 2001. They helped EVs compete on the price buyers actually paid.[4][5]
NOK is the currency code for the Norwegian krone. Yen equivalents are included to help Japanese readers understand the size of each amount.
| Period | National policy | What it meant for buyers and the market |
|---|---|---|
| 1990–2022 | EVs exempt from one-off registration tax | Lower tax at first registration, with support established before mass-market EVs arrived. |
| July 2001–2022 | EV purchases exempt from VAT | The standard rate was initially 24%, later 25%. Exemption helped narrow the purchase-price gap. |
| 2017 | The National Transport Plan set a 2025 zero-emission target for new passenger cars and light vans | A clear direction for vehicle manufacturers and charging operators. |
| 2023–2025 | VAT exemption limited to the first NOK 500,000 (about JPY 8.37 million); a weight-based registration-tax component applied to EVs | Some taxes returned as adoption expanded, while purchase support continued. |
| From January 2026 | VAT exemption limited to the first NOK 300,000 (about JPY 5.02 million); the excess subject to 25% VAT | The purchase date and vehicle price affected the buyer's tax bill. |
Policy checked on 17 October 2026. The 2025 target was a policy goal, not a blanket legal ban on sales of combustion-engine cars.[4][5][6][7][8]
Yen equivalents use Norges Bank’s rate for 16 October 2026: JPY 100 = NOK 5.9746, or about JPY 16.74 per NOK. They illustrate the size of the amounts using one reference rate, not historical exchange rates at each policy’s introduction.[47]
For example, 25% VAT on a pre-tax vehicle price of NOK 500,000 (about JPY 8.37 million) is NOK 125,000 (about JPY 2.09 million). During the full exemption, an EV buyer avoided that VAT charge. Registration-tax relief offered an additional purchase advantage.
Tax changes also affect when people buy. OFV attributed part of the sharp increase at the end of 2025 to purchases brought forward before the January 2026 VAT change. Separating that rush from the long-term transition helps explain the annual figures.[2]
European rules also influenced the manufacturers supplying the cars
Norway is not an EU member, but participates in the European Economic Area (EEA). European limits on new-car CO₂ emissions formed part of the background to manufacturers supplying more low-emission vehicles, including EVs. Norway's own tax policy supported buyers, while European regulation also acted on the supply side.[9]
The LEAF, Tesla and European models gave buyers a wider choice of EVs
The Nissan LEAF arrived in Norway in October 2011. By 2018, its 12,303 registrations made it the country's best-selling passenger-car model across all powertrains.[10][11]
Tesla Model 3 recorded 15,683 registrations in 2019. Model Y and family cars such as the Volkswagen ID.4, Audi e-tron and Škoda Enyaq subsequently broadened the choice. Buyers could increasingly choose an EV around their budget, passenger needs and luggage space.[12][14]
Coloured segments are BEVs; grey represents other powertrains. Model colours and counts are in the table immediately below the chart.
| Manufacturer | Model / colour | Registrations | Share of all new cars |
|---|---|---|---|
| Nissan | LEAF | 3,189 | 2.1% |
| e-NV200 | 263 | 0.2% | |
| Tesla | Model S | 4,039 | 2.7% |
| Volkswagen | e-Golf | 8,943 | 5.9% |
| e-up! | 1,507 | 1.0% | |
| BMW | i3 | 2,368 | 1.6% |
| Ford | Focus Electric | 29 | 0.0% |
| Renault | ZOE | 1,634 | 1.1% |
| Mercedes-Benz | B Electric | 1,352 | 0.9% |
| Kia | Soul EV | 866 | 0.6% |
| Peugeot | iOn | 570 | 0.4% |
| Mitsubishi | i-MiEV | 490 | 0.3% |
| Citroën | C-Zero | 437 | 0.3% |
| smart | fortwo electric | 92 | 0.1% |
| Other BEVs (model detail not shown) | 0 | 0.0% | |
| Combustion, hybrid and other powertrains | 124,907 | 82.9% | |
| All new passenger cars | 150,686 | 100.0% | |
| Manufacturer | Model / colour | Registrations | Share of all new cars |
|---|---|---|---|
| Nissan | LEAF | 4,162 | 2.7% |
| e-NV200 | 347 | 0.2% | |
| Tesla | Model S | 2,051 | 1.3% |
| Model X | 1,430 | 0.9% | |
| Volkswagen | e-Golf | 4,705 | 3.0% |
| e-up! | 1,148 | 0.7% | |
| BMW | i3 | 3,943 | 2.6% |
| Ford | Focus Electric | 47 | 0.0% |
| Hyundai | IONIQ Electric | 646 | 0.4% |
| Renault | ZOE | 1,818 | 1.2% |
| Mercedes-Benz | B Electric | 1,895 | 1.2% |
| Kia | Soul EV | 1,175 | 0.8% |
| Peugeot | iOn | 335 | 0.2% |
| Mitsubishi | i-MiEV | 273 | 0.2% |
| Citroën | C-Zero | 214 | 0.1% |
| smart | fortwo electric | 33 | 0.0% |
| Other BEVs (model detail not shown) | 0 | 0.0% | |
| Combustion, hybrid and other powertrains | 130,381 | 84.3% | |
| All new passenger cars | 154,603 | 100.0% | |
| Manufacturer | Model / colour | Registrations | Share of all new cars |
|---|---|---|---|
| Nissan | LEAF | 3,374 | 2.1% |
| Tesla | Model S | 3,712 | 2.3% |
| Model X | 4,748 | 3.0% | |
| Volkswagen | e-Golf | 6,639 | 4.2% |
| e-up! | 866 | 0.5% | |
| BMW | i3 | 5,035 | 3.2% |
| Hyundai | IONIQ Electric | 1,840 | 1.2% |
| Renault | ZOE | 2,533 | 1.6% |
| Mercedes-Benz | B Electric | 1,444 | 0.9% |
| Opel | Ampera-e | 1,121 | 0.7% |
| Other BEVs (model detail not shown) | 1,713 | 1.1% | |
| Combustion, hybrid and other powertrains | 125,625 | 79.2% | |
| All new passenger cars | 158,650 | 100.0% | |
| Manufacturer | Model / colour | Registrations | Share of all new cars |
|---|---|---|---|
| Nissan | LEAF | 12,303 | 8.3% |
| Tesla | Model X | 4,981 | 3.4% |
| Volkswagen | e-Golf | 7,238 | 4.9% |
| BMW | i3 | 5,687 | 3.8% |
| Other BEVs (model detail not shown) | 15,883 | 10.7% | |
| Combustion, hybrid and other powertrains | 101,837 | 68.8% | |
| All new passenger cars | 147,929 | 100.0% | |
| Manufacturer | Model / colour | Registrations | Share of all new cars |
|---|---|---|---|
| Nissan | LEAF | 6,127 | 4.3% |
| Tesla | Model 3 | 15,683 | 11.0% |
| BMW | i3 | 4,851 | 3.4% |
| Audi | e-tron | 5,377 | 3.8% |
| Jaguar | I-Pace | 3,080 | 2.2% |
| Other BEVs (model detail not shown) | 25,198 | 17.7% | |
| Combustion, hybrid and other powertrains | 82,065 | 57.6% | |
| All new passenger cars | 142,381 | 100.0% | |
| Manufacturer | Model / colour | Registrations | Share of all new cars |
|---|---|---|---|
| Tesla | Model 3 | 7,770 | 5.5% |
| Volkswagen | ID.3 | 7,754 | 5.5% |
| Audi | e-tron | 9,184 | 6.5% |
| Other BEVs (model detail not shown) | 52,081 | 36.8% | |
| Combustion, hybrid and other powertrains | 64,623 | 45.7% | |
| All new passenger cars | 141,412 | 100.0% | |
| Manufacturer | Model / colour | Registrations | Share of all new cars |
|---|---|---|---|
| Nissan | LEAF | 5,313 | 3.0% |
| Tesla | Model 3 | 12,058 | 6.8% |
| Model Y | 8,267 | 4.7% | |
| Volkswagen | ID.4 | 8,645 | 4.9% |
| Audi | e-tron | 5,745 | 3.3% |
| Škoda | Enyaq | 5,711 | 3.2% |
| Ford | Mustang Mach-E | 6,160 | 3.5% |
| Polestar | 2 | 4,103 | 2.3% |
| Other BEVs (model detail not shown) | 57,713 | 32.7% | |
| Combustion, hybrid and other powertrains | 62,561 | 35.5% | |
| All new passenger cars | 176,276 | 100.0% | |
| Manufacturer | Model / colour | Registrations | Share of all new cars |
|---|---|---|---|
| Tesla | Model Y | 17,356 | 10.0% |
| Volkswagen | ID.4 | 11,561 | 6.6% |
| BMW | iX | 6,127 | 3.5% |
| Audi | e-tron | 4,740 | 2.7% |
| Q4 e-tron | 4,928 | 2.8% | |
| Škoda | Enyaq | 7,133 | 4.1% |
| Volvo | XC40 Electric | 5,279 | 3.0% |
| Ford | Mustang Mach-E | 4,226 | 2.4% |
| Hyundai | IONIQ 5 | 5,044 | 2.9% |
| Polestar | 2 | 4,692 | 2.7% |
| Other BEVs (model detail not shown) | 67,179 | 38.5% | |
| Combustion, hybrid and other powertrains | 36,064 | 20.7% | |
| All new passenger cars | 174,329 | 100.0% | |
| Manufacturer | Model / colour | Registrations | Share of all new cars |
|---|---|---|---|
| Nissan | LEAF | 2,471 | 1.9% |
| Ariya | 2,606 | 2.1% | |
| Tesla | Model 3 | 2,083 | 1.6% |
| Model Y | 23,088 | 18.2% | |
| Volkswagen | ID.3 | 3,141 | 2.5% |
| ID.4 | 6,614 | 5.2% | |
| ID.7 | 122 | 0.1% | |
| BMW | iX1 | 2,415 | 1.9% |
| i4 | 1,782 | 1.4% | |
| Audi | Q4 e-tron | 2,688 | 2.1% |
| Škoda | Enyaq | 5,740 | 4.5% |
| Toyota | bZ4X | 5,395 | 4.2% |
| Volvo | EX30 | 6 | 0.0% |
| Ford | Mustang Mach-E | 3,792 | 3.0% |
| Hyundai | IONIQ 5 | 1,566 | 1.2% |
| MG | MG4 | 1,622 | 1.3% |
| Other BEVs (model detail not shown) | 39,457 | 31.1% | |
| Combustion, hybrid and other powertrains | 22,365 | 17.6% | |
| All new passenger cars | 126,953 | 100.0% | |
| Manufacturer | Model / colour | Registrations | Share of all new cars |
|---|---|---|---|
| Nissan | LEAF | 1,608 | 1.2% |
| Ariya | 3,772 | 2.9% | |
| Tesla | Model 3 | 7,264 | 5.6% |
| Model Y | 16,858 | 13.1% | |
| Volkswagen | ID.3 | 3,634 | 2.8% |
| ID.4 | 7,222 | 5.6% | |
| ID.7 | 2,073 | 1.6% | |
| BMW | iX1 | 1,897 | 1.5% |
| i4 | 2,160 | 1.7% | |
| Audi | Q4 e-tron | 3,449 | 2.7% |
| Q6 e-tron | 1,253 | 1.0% | |
| Škoda | Enyaq | 4,610 | 3.6% |
| Toyota | bZ4X | 6,007 | 4.7% |
| Volvo | EX40 | 1,345 | 1.0% |
| EX30 | 7,229 | 5.6% | |
| Ford | Mustang Mach-E | 1,855 | 1.4% |
| Explorer EV | 1,124 | 0.9% | |
| Hyundai | IONIQ 5 | 1,692 | 1.3% |
| Kia | EV3 | 261 | 0.2% |
| BYD | Sealion 7 | 294 | 0.2% |
| XPENG | G6 | 732 | 0.6% |
| MG | MG4 | 2,652 | 2.1% |
| Other BEVs (model detail not shown) | 35,409 | 27.5% | |
| Combustion, hybrid and other powertrains | 14,291 | 11.1% | |
| All new passenger cars | 128,691 | 100.0% | |
| Manufacturer | Model / colour | Registrations | Share of all new cars |
|---|---|---|---|
| Nissan | Ariya | 4,565 | 2.5% |
| Tesla | Model 3 | 6,608 | 3.7% |
| Model Y | 27,621 | 15.4% | |
| Volkswagen | ID.3 | 5,572 | 3.1% |
| ID.4 | 8,802 | 4.9% | |
| ID.7 | 6,976 | 3.9% | |
| BMW | iX1 | 3,486 | 1.9% |
| i4 | 2,949 | 1.6% | |
| Audi | Q4 e-tron | 2,996 | 1.7% |
| Q6 e-tron | 3,250 | 1.8% | |
| Škoda | Enyaq | 4,836 | 2.7% |
| Elroq | 3,894 | 2.2% | |
| Toyota | bZ4X | 7,274 | 4.1% |
| Volvo | EX40 | 5,270 | 2.9% |
| EX30 | 5,206 | 2.9% | |
| Ford | Explorer EV | 4,186 | 2.3% |
| Kia | EV3 | 2,562 | 1.4% |
| BYD | Sealion 7 | 4,274 | 2.4% |
| XPENG | G6 | 2,924 | 1.6% |
| G9 | 1,501 | 0.8% | |
| MG | MG4 | 2,630 | 1.5% |
| Other BEVs (model detail not shown) | 54,850 | 30.5% | |
| Combustion, hybrid and other powertrains | 7,317 | 4.1% | |
| All new passenger cars | 179,549 | 100.0% | |
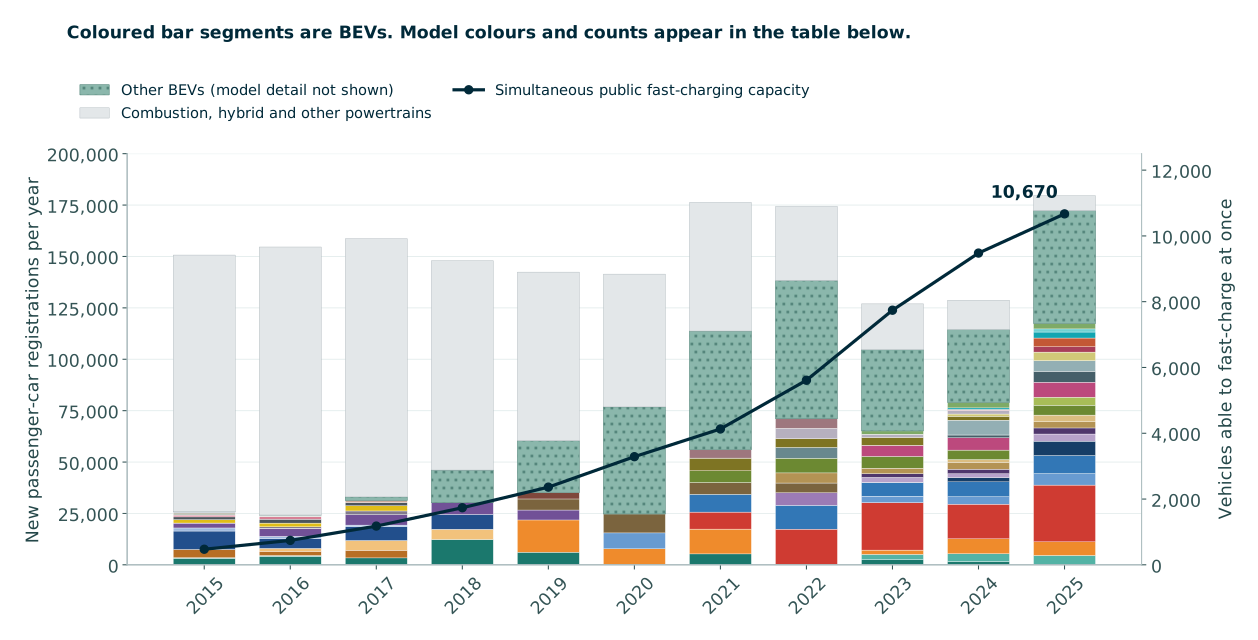
Coloured segments are BEVs; model colours and counts appear in the table immediately below. Bars show annual new passenger-car registrations, with models from each manufacturer stacked together. Hatched green represents BEVs whose model breakdown is not shown; grey represents combustion, hybrid and other powertrains. The line uses the right axis and shows simultaneous fast-charging capacity.
Open a larger chartCompiled from OFV and Norwegian EV Association publications. Model coverage varies by year; models without verified individual counts remain in “Other BEVs”, not in the grey non-BEV category. The chart shows the sales and infrastructure trends together. The 2025 breakdown uses the original published total of 179,549 cars.[39][40][51][11][12][41][13][14][42][43][44][46][50]
Chinese brands gained ground, while Model Y remained the top seller in 2025
OFV reported 24,524 registrations for Chinese-origin brands in 2025, a 13.7% share compared with 10.4% in 2024. BYD ranked tenth among brands. Tesla meanwhile registered 34,285 cars, taking 19.1% of the market, including 27,621 Model Ys. Chinese entrants are adding competition and variety alongside established brands.[2]
In 2025, BYD Sealion 7 recorded 4,274 registrations, XPENG G6 2,924 and MG4 2,630. The 21 models displayed above account for about 65.4% of all new passenger cars. Other BEVs account for about 30.5%, and non-BEVs for about 4.1%.[44][16]
Brands less familiar in Japan are among Norway's leading sellers
Škoda, MG and XPENG may be uncommon sights on Japanese roads. In Norway in 2025, however, Škoda registered 9,408 cars, MG 5,458 and XPENG 4,466. Brand recognition in Japan and demand overseas can differ substantially.[44]
| Brand | Background | Registrations Share of all new cars |
|---|---|---|
| Škoda | A Czech manufacturer, part of Volkswagen Group since 1991.[58] | 9,408 5.2% |
| BYD | A Chinese manufacturer selling models such as Sealion 7 in Norway; tenth among brands in 2025.[2] | 5,927 3.3% |
| MG | A brand established in Britain in 1924, now part of China's SAIC group.[57] | 5,458 3.0% |
| XPENG | A Chinese EV manufacturer founded in 2014, selling the G6 and G9 in Norway.[60][16] | 4,466 2.5% |
| Kia | A Korean manufacturer with roots in 1944, now offering EVs alongside its other vehicles.[59] | 3,901 2.2% |
Manufacturer totals and shares include all powertrains.[44]
Recent EV entrants and manufacturers with long histories compete alongside one another. Norway's sales tables show buyers choosing from a wider range of brands than Japanese readers may encounter at home.
View registrations and market shares by manufacturer in 2025
These totals cover all models and powertrains within each manufacturer.
| Manufacturer | Registrations | Market share |
|---|---|---|
| Tesla | 34,285 | 19.1% |
| Volkswagen | 23,858 | 13.3% |
| Volvo | 14,032 | 7.8% |
| Toyota | 10,374 | 5.8% |
| BMW | 10,109 | 5.6% |
| Škoda | 9,408 | 5.2% |
| Audi | 7,512 | 4.2% |
| Ford | 7,092 | 3.9% |
| Mercedes-Benz | 6,072 | 3.4% |
| BYD | 5,927 | 3.3% |
| Hyundai | 5,874 | 3.3% |
| MG | 5,458 | 3.0% |
| Nissan | 4,670 | 2.6% |
| XPENG | 4,466 | 2.5% |
| Polestar | 3,989 | 2.2% |
| Kia | 3,901 | 2.2% |
| Peugeot | 3,201 | 1.8% |
| Lexus | 1,830 | 1.0% |
| Mazda | 1,797 | 1.0% |
| Renault | 1,591 | 0.9% |
| Other manufacturers | 14,103 | 7.9% |
Chinese brands and Vietnam's VinFast lead much of Southeast Asia's EV market
The shift is even more pronounced in Southeast Asia. The International Energy Agency reports that more than half of electric cars sold in the region in 2025 were Chinese brands, while about one-third came from a Vietnamese manufacturer.[61]
VinFast accounts for nearly all of Vietnam's electric-car market. In Indonesia, Chinese models represented over 75% of electric-car sales in 2025, up by about 20 percentage points from 2024. Brands rarely seen in Japan have become common purchase choices in these markets.[62]
These Southeast Asian figures include both battery electric vehicles (BEVs) and plug-in hybrids (PHEVs). The brand shares refer to electric-car sales, not all new cars.
The cars visible on Japanese roads and those selling overseas can differ considerably. Model and manufacturer data reveal who is supplying the growing range of choices as EV adoption expands.
Public fast charging expanded, with CCS2 becoming the main direction
Norway's public fast-charging network could serve 1,736 vehicles simultaneously in 2018 and 10,670 in 2025. More locations and more spaces to charge help drivers use EVs for holidays as well as daily journeys.[17][18]
For fast-charging connectors, the main comparison is between CHAdeMO, used by early LEAFs, and CCS2 in Europe. Tesla’s European network developed from Type 2 (Tesla-specific DC fast charging) towards CCS2. These standards differ from North American NACS.[21][48]
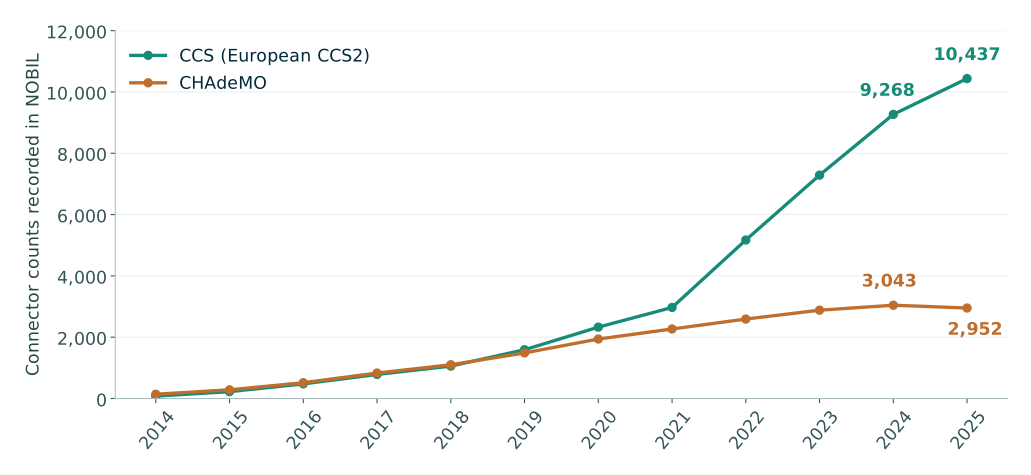
NOBIL records around each year-end, not annual installations. Counts combine the source's fast and semi-fast categories. CCS refers to European CCS2.
Open a larger chartThe year-end 2024 records show 9,268 CCS and 3,043 CHAdeMO connectors. For year-end 2025, the figures are 10,437 and 2,952. CHAdeMO remains in use, while recorded CCS provision continues to expand.[53][54]
NOBIL's recording methods have changed, and some historical Tesla equipment was classified separately. The CCS line follows the source's CCS category; it is not a uniform national census of every physical CCS2 connector.[55][56]
Type 2 AC charging and Tesla-specific DC fast charging explained
Type 2 is used for AC (alternating-current) charging in Europe. For example, Tesla’s European Wall Connector supports up to 22 kW on a three-phase supply. That rating describes this particular product.[63]
Tesla has also used Type 2 for DC (direct-current) fast charging at European Superchargers. V2 posts have both Tesla-specific Type 2 and CCS2 cables; V3 uses CCS2. Looking at the charging method as well as the connector name helps distinguish these types of equipment.[21]
| Region and equipment | Connector and charging method |
|---|---|
| European Wall Connector | Type 2 (AC charging, up to 22 kW on a three-phase supply) |
| European / Norwegian V2 Supercharger | Type 2 (Tesla-specific DC fast charging) and CCS2 (DC fast charging): two different cables on each post |
| European / Norwegian V3 Supercharger | CCS2 (DC fast charging) |
| Standard introduced for North America | NACS: physically different from European Type 2 and CCS2 |
NACS was published as a North American standard. The historical Norwegian “Tesla-only” category described vehicle access, not NACS connectors. A continuous annual series specifically counting Tesla-specific Type 2 fast-charging connectors has not been verified here, so the graph shows the documented CHAdeMO and CCS categories.[48][55]
A post with two connector types may still charge only one car at a time. When planning a journey, checking both connector compatibility and the number of cars that can charge simultaneously makes it easier to choose suitable stops.[20]
View annual connector data
| Year | CHAdeMO | CCS (European CCS2) |
|---|---|---|
| 2014 | 141 | 79 |
| 2015 | 285 | 225 |
| 2016 | 517 | 478 |
| 2017 | 832 | 786 |
| 2018 | 1,102 | 1,059 |
| 2019 | 1,488 | 1,592 |
| 2020 | 1,941 | 2,329 |
| 2021 | 2,269 | 2,971 |
| 2022 | 2,593 | 5,171 |
| 2023 | 2,882 | 7,287 |
| 2024 | 3,043 | 9,268 |
| 2025 | 2,952 | 10,437 |
These observations are around each year-end and combine NOBIL's fast and semi-fast categories. Each year links to its dated source record.
Public support helped build both public chargers and shared residential wiring
A 2009 Norwegian programme covered 100% of installation costs for public charging points, up to NOK 30,000 (about JPY 500,000) per point. It is one example of government action to make charging available during the early market.[22]
Support later addressed gaps in the fast-charging network. In April 2022, the public agency Enova said it had supported 250 charging locations with about NOK 150 million (about JPY 2.5 billion) since 2015. It also noted that most new locations were by then being built without support. Public funding was increasingly complementing a market capable of attracting private investment.[23]
Oslo helped housing associations install common wiring in their garages
Being able to charge on arriving home is an everyday benefit. Oslo introduced support for shared residential charging infrastructure in 2017. Its 2020 account described a grant covering 20% of costs. By 20 December 2019, 903 housing associations had submitted applications covering infrastructure for 46,000 parking spaces.[24]
At Røverkollen, the city's example involved common wiring across a 230-space garage, allowing residents to add their own chargers as needed. Preparing the shared infrastructure first lets use grow as residents switch to EVs.[24]
Engine heaters in Norway also use external electricity. Research on the history of EV adoption describes early charging from outdoor sockets at buildings, followed by dedicated wall-mounted chargers. Developing charging around existing electrical provision offers a useful example for Japanese apartment buildings considering shared wiring and a phased installation.[25][38]
Charging improved through both compatible connectors and automatic authentication
A connector that fits and a service that authenticates automatically are different features. CCS2 describes a connection system; Plug & Charge lets a compatible vehicle and charging service communicate to authenticate a session.
| Period | Development | Benefit for drivers |
|---|---|---|
| 2010s | CCS2 expanded alongside CHAdeMO in Europe | More European-market EVs could share a common fast-charging connection. |
| 2014 | ISO 15118-2 published | A foundation for vehicle–charger communication and Plug & Charge. |
| 2020s | Networks including IONITY supported Plug & Charge | Compatible vehicles and contracts can reduce repeated card or app authentication. |
| 2022 | ISO 15118-20 published | A second generation of communication standards. Plug & Charge already existed before this publication. |
Publication dates are distinct from rollout dates in vehicles and chargers.[26][27][28][29]
ISO 15118 also applies to AC charging designs. However, the statistics reviewed here do not establish what share of Norwegian AC chargers actively supports power-line communication (PLC) or Plug & Charge. For a deployment, matching the vehicle, charger and authentication service is what turns that capability into fewer steps for the driver.[30]
EVs made up about 96% of new cars, but about 32% of the registered fleet
Older cars remain in use after new-car preferences change. SSB recorded 2,935,738 registered passenger cars at the end of 2025, including 945,182 BEVs, or 32.2%. The remainder includes petrol, diesel and hybrid cars.[31]
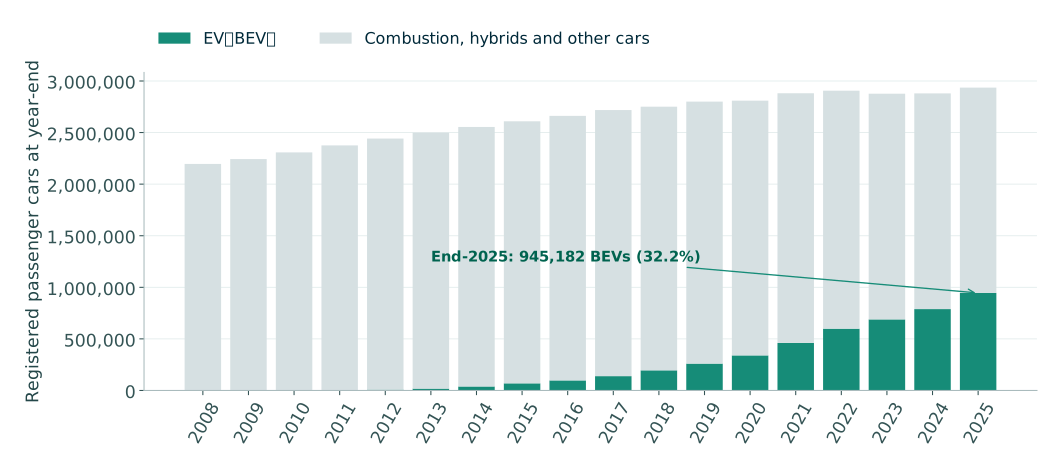
Year-end registered passenger cars, including private and corporate ownership, aggregated from SSB table 07849. EVs use the electric fuel category. These are stock counts, not annual sales or kilometres driven.
Open a larger chartAs EVs continue to dominate new purchases, the composition of the fleet changes through replacement. Norway is moving from a predominantly electric new-car market towards an increasingly electric fleet.
Private purchases and company or leased vehicles adopted EVs at different rates
The fleet chart includes cars used by households as well as passenger cars owned by businesses and leasing companies. In 2021, BEVs accounted for 83.1% of direct private new-car purchases, compared with 42.6% in the combined company and leasing category. These purchase channels were adopting EVs at different rates.[14]
Ownership and use differ: a leasing company can own a car used by a household. SSB analyses distinguish these roles. We did not verify a consistent public 2008–2025 series crossing private/corporate ownership with powertrain for the whole fleet, so the fleet chart retains the observed overall counts. Considering who uses the vehicles also helps identify the charging locations and routines they need.[49]
EV owners value running costs, quietness and everyday convenience
Purchases tell only part of the story. In the Norwegian EV Association's Elbilisten 2025 survey, 92% of 15,325 responding EV users said they were satisfied or very satisfied with their EV.[32]
In its 2026 survey, 67% of responding EV users said their household owned only EVs, compared with 26% in 2016. More families were relying on EVs for their household's motoring, rather than only as a supplementary second car.[33]
The 2026 survey ran from 31 March to 3 May and had nearly 15,000 EV-user respondents. The percentage above refers to households of EV users.
Drivers also learn from winter experience when choosing their next car
In a July 2025 interview with Motor, published by NAF, podcast editor Stein Morten Lier cited lower charging and toll costs as reasons for choosing an EV. He also valued a quiet cabin for recording.[34]
He described a difficult winter fast-charging experience with an earlier car and made battery preheating a priority for his next choice. Knowing EVs' benefits does not remove the need to plan for winter; it helps identify which features matter in everyday use.[34]
Services are improving too. In the EV Association's survey, the proportion finding fast-charging prices difficult to understand fell from 70% in 2025 to 55% in 2026. Clear prices and straightforward operation are another part of making EVs easier to use.[35]
Overnight charging and preheating make EVs more practical in cold regions
NAF's winter tests confirm that low temperatures affect range and fast charging. Its guidance recommends warming the cabin while plugged in and, in cars with battery preheating, preparing the battery for fast charging on longer journeys.[36][37]
For a car parked overnight at a home or business in Japan, charging during that parked time can replenish the next day's driving, with cabin heating scheduled for departure. Drivers who travel farther can include winter range, battery preheating and charging stops in their vehicle selection.
Norway addressed winter conditions while developing purchase support, a wider choice of cars and charging at home and away. Together, these changes made EVs a practical everyday choice. Considering the vehicle and its daily routine together is a useful starting point in Japan too.
Plan EV charging around your home or business
Whether you want to charge company cars overnight or add chargers to shared residential parking, LinkT&B can discuss equipment and operation around parking time, driving distance and the installation site.
Sources and data
Sources checked on 17 October 2026. Charts prepared by LinkT&B from published data; coverage and definitions are stated alongside each chart.
- SSB: new vehicle registrations, table 14020 Back
- OFV: new-car registrations in 2025 Back
- OFV: latest registration figures Back
- Norwegian Government: NOU 2022:20, chapter 15 Back
- Norwegian Government: 2001 budget agreement Back
- Norwegian Government: National Transport Plan 2018–2029 Back
- Norwegian Tax Administration: VAT handbook, section 6-8 Back
- Norwegian Tax Administration: one-off registration tax Back
- Norwegian Government: vehicle CO₂ regulations and the EEA Back
- Nissan: LEAF launch history in Norway Back
- OFV: 2018 registrations Back
- OFV: 2019 registrations Back
- OFV: 2021 registrations Back
- Norwegian EV Association: 2021 models, OFV data Back
- XPENG: 2025 results in Norway Back
- Norwegian EV Association: fast charging in 2024 Back
- Norwegian EV Association: fast charging in 2025 Back
- NOBIL: charging-statistics definitions Back
- Tesla: European Supercharging connections Back
- IEA: Norway's 2009 infrastructure investment programme Back
- Enova: charging-network support, 5 April 2022 Back
- City of Oslo: shared residential charging and grants, 2020 Back
- Figenbaum: 35 years of BEVs in Norway, EVS38, 2025 Back
- ISO: ISO 15118-2:2014 Back
- ISO: ISO 15118-20:2022 Back
- CharIN: Plug & Charge and PKI Back
- IONITY: access and payment Back
- ABB E-mobility: ISO 15118 white paper, 2024 Back
- SSB: registered passenger cars by fuel, table 07849 Back
- Norwegian EV Association: Elbilisten 2025 Back
- Norwegian EV Association: EV-only households, 31 July 2026 Back
- Motor: interview with Stein Morten Lier, July 2025 Back
- Norwegian EV Association: fast-charging price transparency, 9 July 2026 Back
- NAF: winter EV test 2026 Back
- NAF: EV preheating, updated October 2026 Back
- NAF: engine heaters, updated 2023 Back
- Norwegian EV Association: 2015/2016 BEV model table (OFV) Back
- Norwegian EV Association: 2017 leading BEV models (OFV) Back
- Norwegian EV Association: 2020 registrations Back
- Norwegian EV Association: 2022 leading models (OFV) Back
- OFV release: 2023/2024 model and powertrain counts Back
- OFV release: 2025 top 20 models, top 20 brands and powertrains Back
- Norwegian EV Association: annual simultaneous fast-charging capacity Back
- Norges Bank: JPY/NOK exchange rate, 16 October 2026 Back
- Tesla: introducing the North American Charging System Back
- SSB: owners and users of passenger cars in 2024 Back
- OFV: Bilåret 2025 annual presentation Back
- Norwegian EV Association: leading BEV models in 2018 (OFV) Back
- NOBIL: year-end 2024 charging records Back
- NOBIL: year-end 2025 charging records Back
- NOBIL: statistical definitions Back
- NOBIL: changes to connector records Back
- MG: brand profile Back
- Škoda: 30 years in Volkswagen Group Back
- Kia: history from 1944 Back
- XPENG: corporate story Back
- IEA: Global EV Outlook 2026, Executive summary Back
- IEA: Global EV Outlook 2026, Trends in electric cars Back
- Tesla: European Wall Connector (Type 2, up to 22 kW) Back